> ## Documentation Index
> Fetch the complete documentation index at: https://docs.crisp.trade/llms.txt
> Use this file to discover all available pages before exploring further.
# Smart Money Tab
> Track where experienced traders are positioning
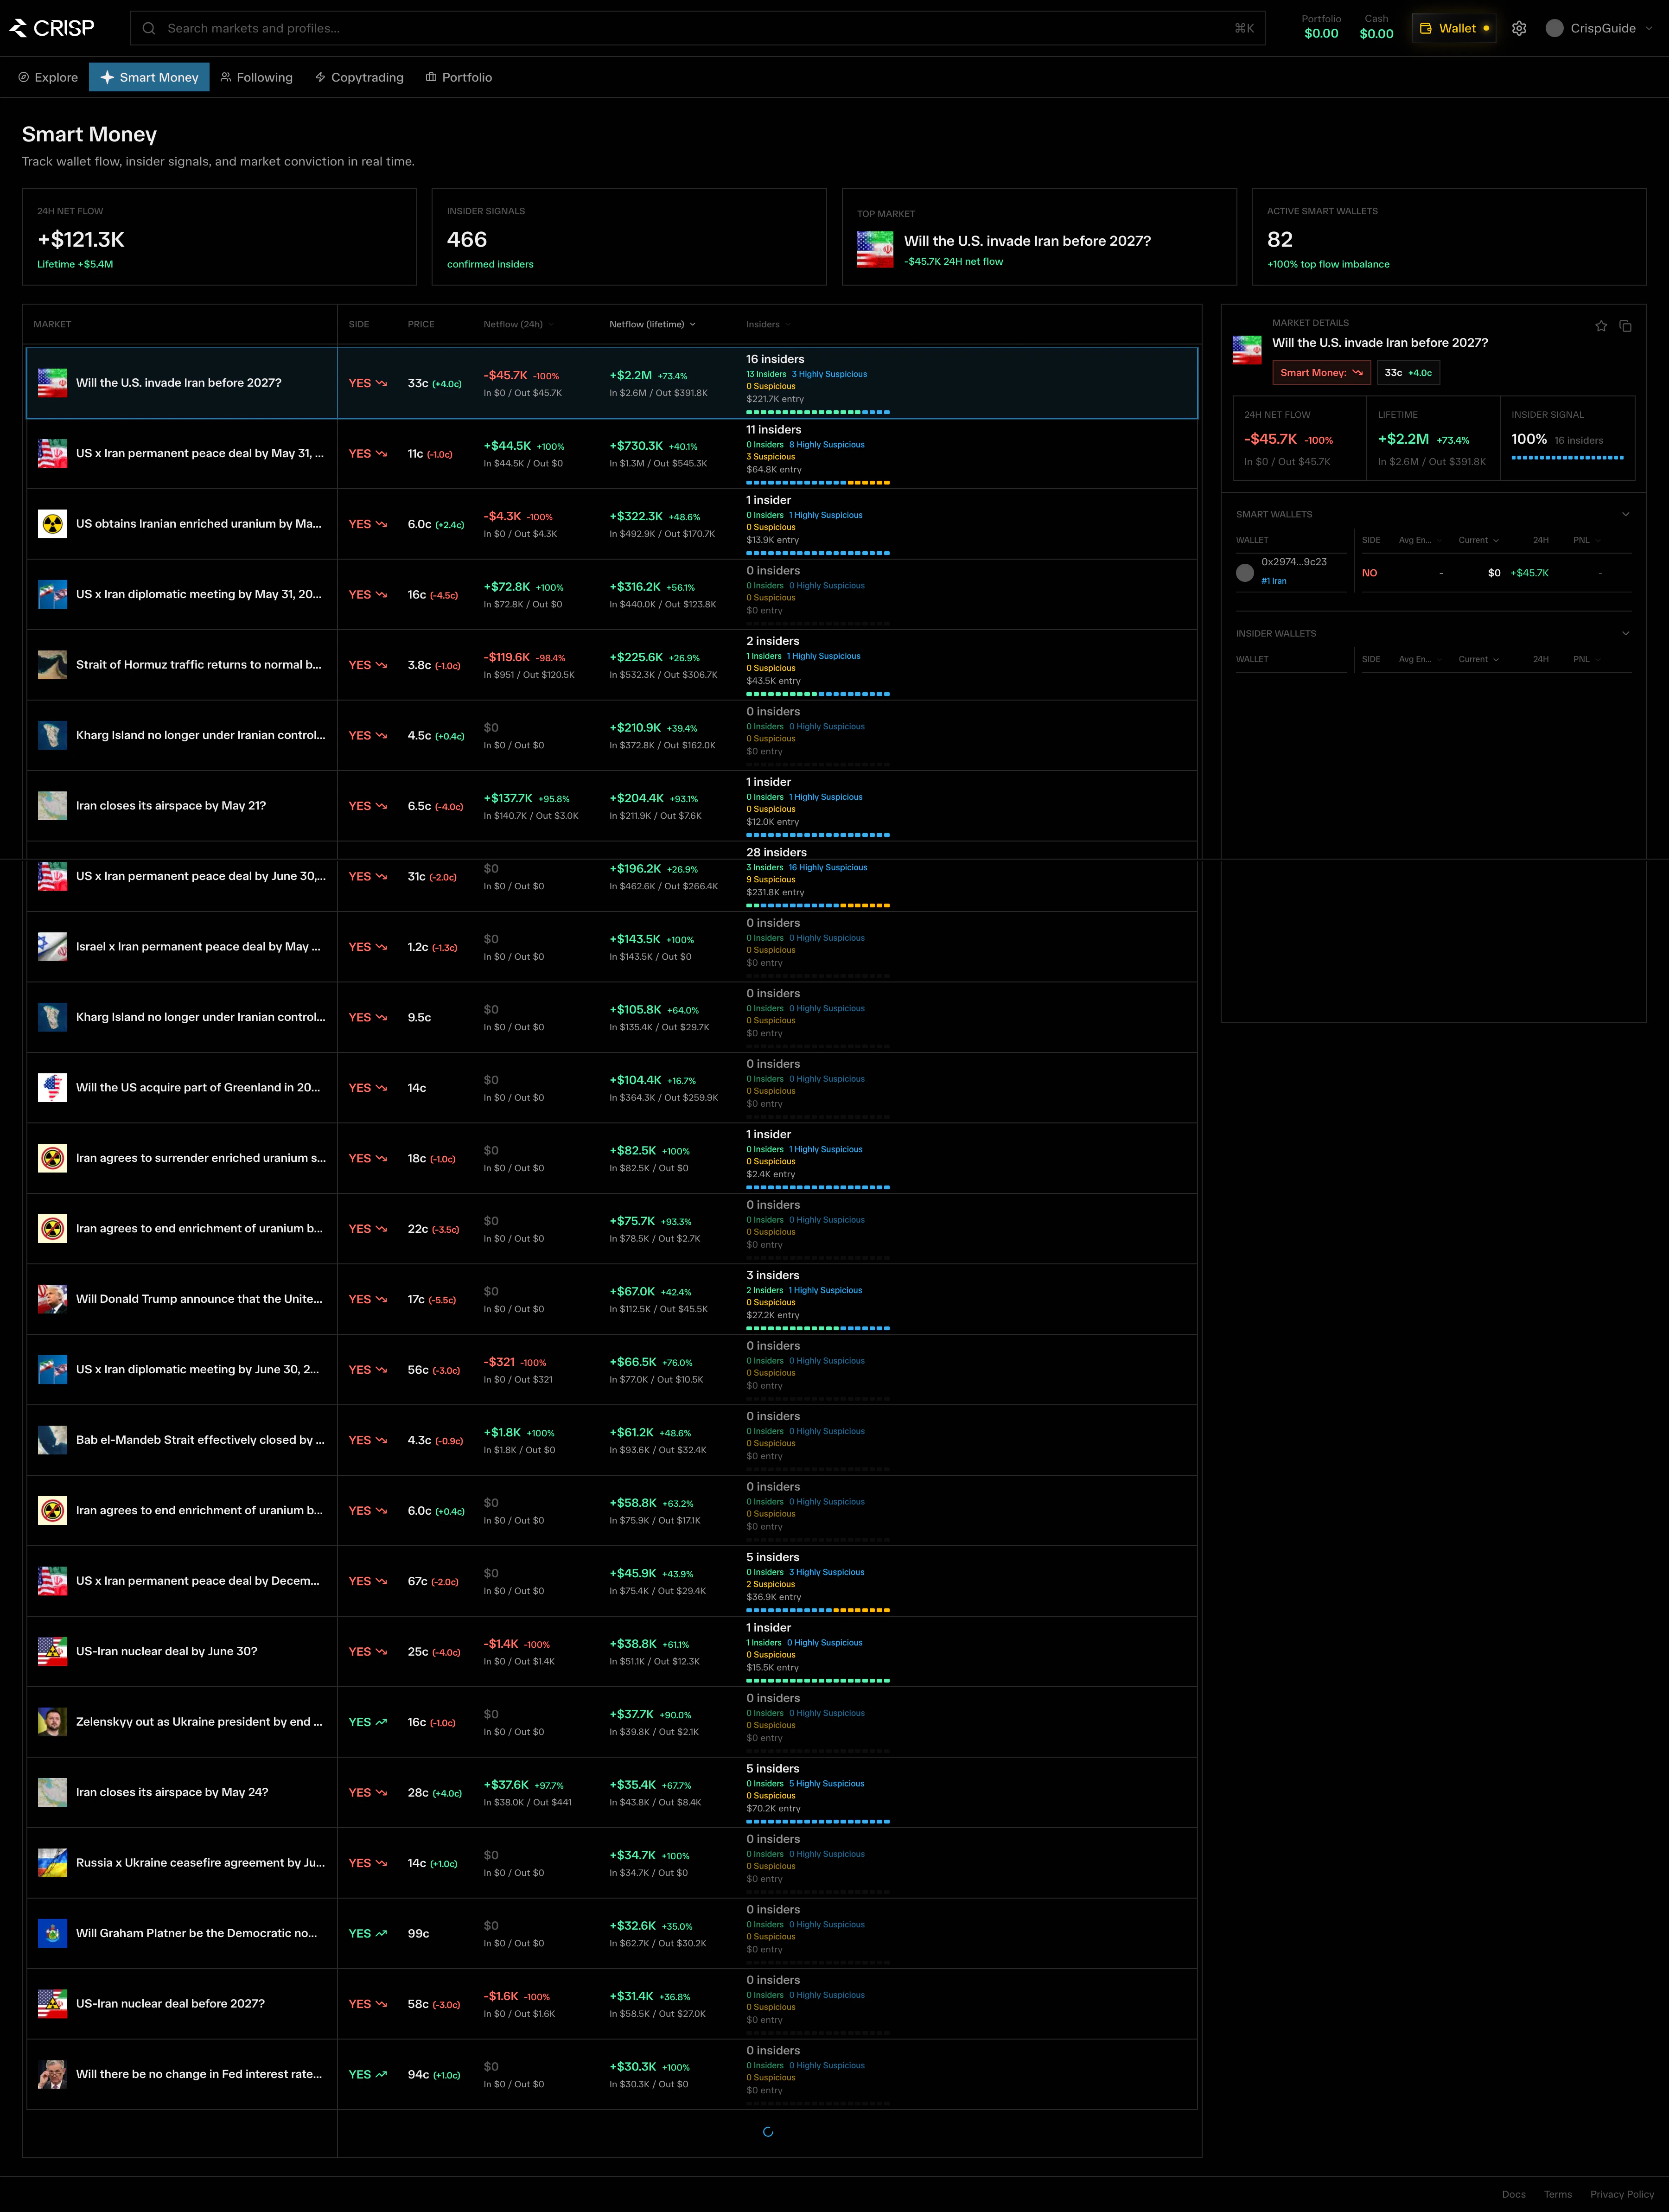
The **Smart Money** page shows markets with notable activity from high-signal wallets and traders.
Use this page to understand where experienced market participants are moving capital, which outcomes they are trading, and how smart money activity is distributed across active prediction markets.
 ## Overview
Smart Money is designed to help users discover markets based on wallet behavior, not only market popularity or volume.
The page highlights:
* Markets with smart money inflow
* The side smart money is taking, such as YES or NO
* Net capital flow from tracked wallets
* Number of smart traders involved
* Recent market and wallet activity
* Market-level details for deeper analysis
## Summary Cards
The top of the page shows a high-level snapshot of current smart money activity.
| Card | Description |
| -------------------- | -------------------------------------------------------------------------------- |
| Net Smart Money Flow | Total net capital flow from tracked smart money wallets over the selected period |
| Tracked Markets | Number of markets currently monitored for smart money activity |
| Top Market | Market with the most notable smart money activity |
| Active Smart Money | Number of active smart money signals currently detected |
These cards provide a quick overview of where smart money activity is concentrated before reviewing individual markets.
## Market Table
The market table lists markets where CRISP has detected smart money activity.
Each row represents one market and shows the key signals needed to compare opportunities quickly.
| Column | Description |
| ---------------- | --------------------------------------------------------------------- |
| Market | The prediction market being tracked |
| Side | The outcome smart money is currently positioned on, such as YES or NO |
| Price | Current price of the selected outcome |
| Volume | Total trading volume for the market |
| Smart Money Flow | Net capital flow from smart money wallets |
| Smart Traders | Number of tracked smart wallets or traders active in the market |
| Activity | Recent smart money movement, wallet behavior, or related signal |
Clicking a market opens the market detail panel on the right.
## Market Detail Panel
The market detail panel provides a deeper view of the selected market.
This panel may include:
* Market title
* Market image or icon
* Current YES and NO prices
* Recent price movement
* 24H volume
* Liquidity
* Smart money netflow
* Number of smart traders active in the market
* Recent smart money trades
* Wallet or trader-level activity
Use this panel to understand whether smart money activity is coming from one wallet, several wallets, or a broader group of high-signal traders.
## Smart Money Flow
**Smart Money Flow** shows the net capital movement from wallets or traders classified by CRISP as high-signal participants.
A **positive flow** means smart money is moving into the market.
A **negative flow** means smart money is reducing exposure or exiting the market.
Smart Money Flow is useful for identifying markets where high-signal participants may be building conviction.
## Smart Traders
Smart traders are wallets or profiles that CRISP identifies as meaningful signals based on trading behavior.
This may include factors such as:
* Historical profitability
* ROI
* Win rate
* Trade count
* Position timing
* Market-specific performance
* Repeated activity in profitable markets
* Insider or high-signal wallet labels, if available
Smart trader activity helps users understand the quality of the flow behind a market.
## Trader Activity
The trader activity section shows how smart money participants are trading the selected market.
Depending on available data, this section may show:
| Field | Description |
| ------ | --------------------------------------------- |
| Trader | Wallet or trader involved in the market |
| Side | Outcome the trader is buying or selling |
| Size | Trade size or position size |
| Entry | Average entry price, if available |
| P\&L | Current or realized performance, if available |
| Time | When the activity occurred |
This helps users evaluate whether a market signal is supported by meaningful trader behavior.
## Overview
Smart Money is designed to help users discover markets based on wallet behavior, not only market popularity or volume.
The page highlights:
* Markets with smart money inflow
* The side smart money is taking, such as YES or NO
* Net capital flow from tracked wallets
* Number of smart traders involved
* Recent market and wallet activity
* Market-level details for deeper analysis
## Summary Cards
The top of the page shows a high-level snapshot of current smart money activity.
| Card | Description |
| -------------------- | -------------------------------------------------------------------------------- |
| Net Smart Money Flow | Total net capital flow from tracked smart money wallets over the selected period |
| Tracked Markets | Number of markets currently monitored for smart money activity |
| Top Market | Market with the most notable smart money activity |
| Active Smart Money | Number of active smart money signals currently detected |
These cards provide a quick overview of where smart money activity is concentrated before reviewing individual markets.
## Market Table
The market table lists markets where CRISP has detected smart money activity.
Each row represents one market and shows the key signals needed to compare opportunities quickly.
| Column | Description |
| ---------------- | --------------------------------------------------------------------- |
| Market | The prediction market being tracked |
| Side | The outcome smart money is currently positioned on, such as YES or NO |
| Price | Current price of the selected outcome |
| Volume | Total trading volume for the market |
| Smart Money Flow | Net capital flow from smart money wallets |
| Smart Traders | Number of tracked smart wallets or traders active in the market |
| Activity | Recent smart money movement, wallet behavior, or related signal |
Clicking a market opens the market detail panel on the right.
## Market Detail Panel
The market detail panel provides a deeper view of the selected market.
This panel may include:
* Market title
* Market image or icon
* Current YES and NO prices
* Recent price movement
* 24H volume
* Liquidity
* Smart money netflow
* Number of smart traders active in the market
* Recent smart money trades
* Wallet or trader-level activity
Use this panel to understand whether smart money activity is coming from one wallet, several wallets, or a broader group of high-signal traders.
## Smart Money Flow
**Smart Money Flow** shows the net capital movement from wallets or traders classified by CRISP as high-signal participants.
A **positive flow** means smart money is moving into the market.
A **negative flow** means smart money is reducing exposure or exiting the market.
Smart Money Flow is useful for identifying markets where high-signal participants may be building conviction.
## Smart Traders
Smart traders are wallets or profiles that CRISP identifies as meaningful signals based on trading behavior.
This may include factors such as:
* Historical profitability
* ROI
* Win rate
* Trade count
* Position timing
* Market-specific performance
* Repeated activity in profitable markets
* Insider or high-signal wallet labels, if available
Smart trader activity helps users understand the quality of the flow behind a market.
## Trader Activity
The trader activity section shows how smart money participants are trading the selected market.
Depending on available data, this section may show:
| Field | Description |
| ------ | --------------------------------------------- |
| Trader | Wallet or trader involved in the market |
| Side | Outcome the trader is buying or selling |
| Size | Trade size or position size |
| Entry | Average entry price, if available |
| P\&L | Current or realized performance, if available |
| Time | When the activity occurred |
This helps users evaluate whether a market signal is supported by meaningful trader behavior.